How to Build a Time-Series RAG for Forecasting Data
In this article
What is Time-Series RAG?
Time-Series RAG (Retrieval-Augmented Generation) is an advanced forecasting and analytics approach where an LLM (Large Language Model) predicts or explains future values by retrieving the most relevant time-series data, patterns, and statistical insights instead of relying only on the model's internal knowledge.
Think of it as: LLM + Retrieved Time-Series Context = More accurate predictions + better explanations + domain-aware results
It extends classical RAG (used for text) into the numerical forecasting world.
Why We Need Time-Series RAG
Traditional forecasting models (ARIMA, Prophet, LSTMs, Transformers) work only with the training dataset. But real-time scenarios require:
- External factors
- Similar past patterns
- Domain knowledge
- Related time windows
- Event triggers (holiday effects, promotions, weather, outages, etc.)
Time-Series RAG fills this gap by dynamically retrieving the most relevant information (like past patterns, anomalies, similar windows) and feeding it to the LLM.
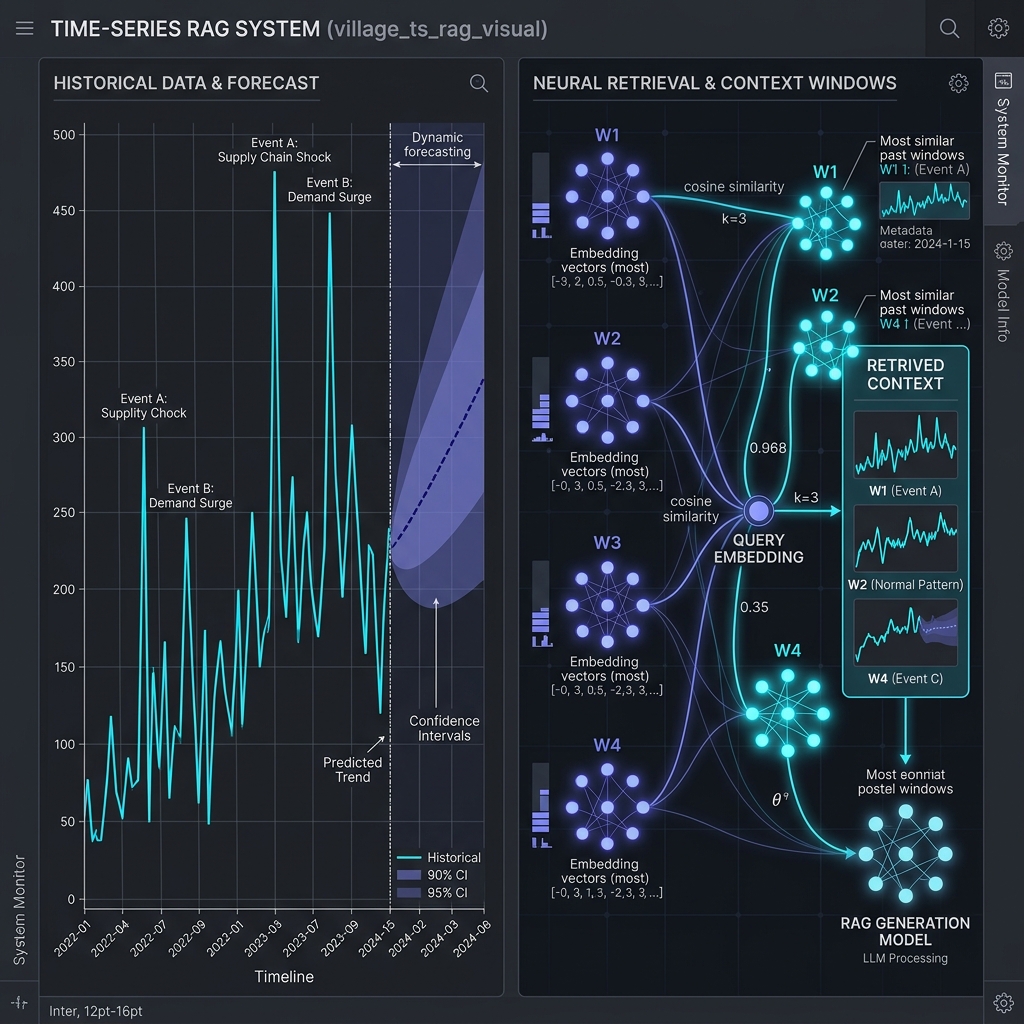
How Time-Series RAG Works (Simple Flow)
- Data Storage: You store time-series data in a specialized vector database:
- Chunks: Windows (e.g., 7-day sequence, 30-day sequence).
- Embeddings: Numerical + textual context.
- Query (User or System Trigger):
- "Forecast next 30 days of sales for Store-17"
- "Explain the drop in traffic last week."
- "Retrieve past periods with similar demand spikes."
- Retrieval: The vector DB retrieves:
- Similar historical windows (pattern matching)
- Seasonal patterns (weekends, holidays, months)
- Anomaly events (price changes, outages)
- Correlated time-series (weather, marketing, traffic)
- Generation: The LLM uses retrieved information to forecast, generate explanations, describe causal relationships, and provide actions or strategy insights.
System Architecture Overview
The Time-Series RAG system consists of four core components:
- Time-Series Data Ingestion Layer: Handles data preprocessing, feature engineering, and temporal indexing.
- Vector Storage Layer: Stores embeddings of time-series segments with temporal metadata.
- Retrieval Engine: Performs similarity search on temporal patterns with time-aware filtering.
- Generation Layer: Uses LLM to interpret patterns and generate forecasts with contextual explanations.
Prerequisites
Required Skills:
- Python programming (intermediate)
- Time-series analysis fundamentals
- Basic understanding of vector databases
- Familiarity with ML concepts
Infrastructure Requirements:
- Python 3.9+
- 16GB RAM minimum (32GB recommended)
- GPU optional but recommended for embeddings
- Vector database (Pinecone, Weaviate, or Qdrant)
Core System Architecture (ASCII)
┌─────────────────────────────────────────────────────────────────────────┐
│                          TIME-SERIES RAG SYSTEM                         │
└─────────────────────────────────────────────────────────────────────────┘
        ┌──────────────────┐
        │   Data Sources   │
        │ - CSV/Parquet    │
        │ - Databases      │
        │ - APIs           │
        │ - Streaming      │
        └────────┬─────────┘
                 ▼
┌─────────────────────────────────────────────────────────────────────────┐
│                    INGESTION LAYER                                      │
│ ┌──────────────┐   ┌──────────────┐   ┌──────────────┐                  │
│ │  Validation  │ → │   Cleaning   │ → │  Resampling  │                  │
│ └──────────────┘   └──────────────┘   └──────────────┘                  │
└────────────────────────┬────────────────────────────────────────────────┘
                         ▼
┌─────────────────────────────────────────────────────────────────────────┐
│                  FEATURE ENGINEERING LAYER                              │
│ ┌──────────────┐   ┌──────────────┐   ┌──────────────┐                  │
│ │   Temporal   │   │  Statistical │   │ Decomposition│                  │
│ │   Features   │   │   Features   │   │   (STL/MSTL) │                  │
│ └──────────────┘   └──────────────┘   └──────────────┘                  │
│ ┌──────────────┐   ┌──────────────┐                                     │
│ │ Lag Features │   │ Rolling Stats│                                     │
│ └──────────────┘   └──────────────┘                                     │
└────────────────────────┬────────────────────────────────────────────────┘
                         ▼
┌─────────────────────────────────────────────────────────────────────────┐
│                  EMBEDDING GENERATION LAYER                             │
│ ┌────────────────────────────────────────────────────────────┐          │
│ │                 Sliding Window Creation                    │          │
│ │ [t1...t30]  [t2...t31]  [t3...t32] ... [tn...tn+30]        │          │
│ └────────────────┬───────────────────────────────────────────┘          │
│                  ▼                                                      │
│ ┌──────────────────────────────┐      ┌─────────────────────┐           │
│ │    Statistical Embeddings    │      │    LLM Embeddings   │           │
│ │ - Mean, Std, Min, Max        │      │ - text-embedding-3  │           │
│ │ - Percentiles, Trend         │      │ - OpenAI/Cohere     │           │
│ └──────────────────────────────┘      └─────────────────────┘           │
└────────────────────────┬────────────────────────────────────────────────┘
                         ▼
┌─────────────────────────────────────────────────────────────────────────┐
│                          VECTOR STORAGE LAYER                           │
│ ┌──────────────────────────────────────────────────────────┐            │
│ │           Vector Database (Qdrant/Pinecone)              │            │
│ │ ┌──────────┐ ┌──────────┐ ┌──────────┐ ┌─────────┐       │            │
│ │ │ Vector 1 │ │ Vector 2 │ │ Vector 3 │ │   ...   │       │            │
│ │ │  Meta 1  │ │  Meta 2  │ │  Meta 3  │ │   ...   │       │            │
│ │ └──────────┘ └──────────┘ └──────────┘ └─────────┘       │            │
│ │ Metadata: timestamp, stats, seasonal_period, trend       │            │
│ └──────────────────────────────────────────────────────────┘            │
└────────────────────────┬────────────────────────────────────────────────┘
                         ▼
┌─────────────────────────────────────────────────────────────────────────┐
│                          RETRIEVAL LAYER                                │
│ ┌──────────────────────────────────────────────────────────┐            │
│ │ Query Window → Embedding → Vector Search                 │            │
│ └────────────────┬─────────────────────────────────────────┘            │
│                  ▼                                                      │
│ ┌──────────────────────────────┐      ┌─────────────────────┐           │
│ │       Similarity Search      │      │  Temporal Filtering │           │
│ │ - Cosine/Euclidean           │      │ - Time ranges       │           │
│ │ - Top-K retrieval            │      │ - Seasonal matches  │           │
│ └──────────────────────────────┘      └─────────────────────┘           │
│ ┌──────────────────────────────────────────────────────────┐            │
│ │               Reranking with Temporal Scores             │            │
│ │      Final_Score = α·Similarity + β·Recency + γ·Seasonal │            │
│ └──────────────────────────────────────────────────────────┘            │
└────────────────────────┬────────────────────────────────────────────────┘
                         ▼
┌─────────────────────────────────────────────────────────────────────────┐
│                        GENERATION LAYER (LLM)                           │
│ ┌──────────────────────────────────────────────────────────┐            │
│ │    Context Assembly                                      │            │
│ │ - Current time-series state                              │            │
│ │ - Top-K similar patterns + outcomes                      │            │
│ │ - Seasonal context                                       │            │
│ │ - Statistical summaries                                  │            │
│ └────────────────┬─────────────────────────────────────────┘            │
│                  ▼                                                      │
│ ┌──────────────────────────────────────────────────────────┐            │
│ │         LLM Prompt Construction                          │            │
│ │ System: "You are a time-series forecasting expert..."    │            │
│ │ User: Context + Task + Output Format                     │            │
│ └────────────────┬─────────────────────────────────────────┘            │
│                  ▼                                                      │
│ ┌──────────────────────────────────────────────────────────┐            │
│ │         LLM Generation (GPT-4/Claude/Gemini)             │            │
│ │ - Point forecasts                                        │            │
│ │ - Confidence intervals                                   │            │
│ │ - Reasoning & explanations                               │            │
│ │ - Risk factors                                           │            │
│ └──────────────────────────────────────────────────────────┘            │
└────────────────────────┬────────────────────────────────────────────────┘
                         ▼
┌─────────────────────────────────────────────────────────────────────────┐
│                            OUTPUT LAYER                                 │
│ ┌──────────────┐      ┌──────────────┐      ┌──────────────┐            │
│ │  Structured  │      │ Visualizations │      │ Explanations │            │
│ │  Forecasts   │      │ (Plotly)       │      │ (Natural Lang)│            │
│ └──────────────┘      └──────────────┘      └──────────────┘            │
└─────────────────────────────────────────────────────────────────────────┘
Implementation Code
Configuration and Dependencies
import os
from datetime import datetime, timedelta
from typing import List, Dict, Any, TypedDict, Annotated, Optional
import operator
import json
from pydantic import BaseModel, Field

# Core LangChain imports
from langchain_openai import ChatOpenAI, OpenAIEmbeddings
from langchain_core.documents import Document
from langchain_core.prompts import ChatPromptTemplate
from langchain_core.output_parsers import StrOutputParser, JsonOutputParser
from langchain_core.runnables import RunnablePassthrough
from langchain_core.runnables.base import Runnable

# Vector store
from langchain_chroma import Chroma

# LangGraph imports
from langgraph.graph import StateGraph, END
from langgraph.checkpoint.memory import MemorySaver

# Time series libraries
import pandas as pd
import numpy as np
from prophet import Prophet
from statsmodels.tsa.seasonal import seasonal_decompose

# Data processing
from sklearn.preprocessing import StandardScaler

class Config:
    OPENAI_API_KEY = os.getenv("OPENAI_API_KEY")
    MODEL_NAME = "gpt-4o"
    EMBEDDING_MODEL = "text-embedding-3-large"
    VECTOR_DB_PATH = "./chroma_ts_db"
    CHUNK_SIZE = 1000
    CHUNK_OVERLAP = 200
    TOP_K = 5
Time Series Processor
class TimeSeriesProcessor:
    """Process and analyze time series data"""
    def __init__(self):
        self.scaler = StandardScaler()

    def create_temporal_features(self, df: pd.DataFrame, date_column: str) -> pd.DataFrame:
        df = df.copy()
        df[date_column] = pd.to_datetime(df[date_column])
        df['year'] = df[date_column].dt.year
        df['month'] = df[date_column].dt.month
        df['day'] = df[date_column].dt.day
        df['day_of_week'] = df[date_column].dt.dayofweek
        df['quarter'] = df[date_column].dt.quarter
        df['is_weekend'] = df['day_of_week'].isin([5, 6]).astype(int)

        if 'value' in df.columns:
            df['rolling_mean_7'] = df['value'].rolling(window=7, min_periods=1).mean()
            df['rolling_std_7'] = df['value'].rolling(window=7, min_periods=1).std()
            df['rolling_mean_30'] = df['value'].rolling(window=30, min_periods=1).mean()
        return df

    def decompose_time_series(self, df: pd.DataFrame, value_column: str, period: int = 7) -> Dict[str, np.ndarray]:
        try:
            result = seasonal_decompose(df[value_column].dropna(), model='additive', period=period)
            return {
                'trend': result.trend.values if result.trend is not None else np.array([]),
                'seasonal': result.seasonal.values if result.seasonal is not None else np.array([]),
                'residual': result.resid.values if result.resid is not None else np.array([])
            }
        except Exception as e:
            print(f"Decomposition failed: {e}")
            return {}

    def forecast_prophet(self, df: pd.DataFrame, periods: int = 30) -> pd.DataFrame:
        prophet_df = df[['ds', 'y']].copy()
        model = Prophet(yearly_seasonality=True, weekly_seasonality=True, daily_seasonality=False)
        model.fit(prophet_df)
        future = model.make_future_dataframe(periods=periods)
        forecast = model.predict(future)
        return forecast[['ds', 'yhat', 'yhat_lower', 'yhat_upper']]

    def calculate_statistics(self, df: pd.DataFrame, value_column: str) -> Dict[str, float]:
        values = df[value_column].dropna()
        if values.empty:
            return {'mean': float('nan'), 'std': float('nan'), 'min': float('nan'), 'max': float('nan')}
        return {
            'mean': float(values.mean()),
            'median': float(values.median()),
            'std': float(values.std()),
            'min': float(values.min()),
            'max': float(values.max()),
            'q25': float(values.quantile(0.25)),
            'q75': float(values.quantile(0.75))
        }
Time Series Document Creator
class TimeSeriesDocumentCreator:
    """Convert time series data into documents for RAG"""
    def __init__(self, processor: TimeSeriesProcessor):
        self.processor = processor

    def create_temporal_chunks(self, df: pd.DataFrame, date_column: str, value_column: str, window_size: int = 30) -> List[Document]:
        documents = []
        df = df.sort_values(date_column)
        for i in range(0, len(df), window_size // 2):
            window_df = df.iloc[i:i + window_size]
            if len(window_df) < 5: continue

            stats = self.processor.calculate_statistics(window_df, value_column)
            start_date = window_df[date_column].min()
            end_date = window_df[date_column].max()

            content = f"""Time Period: {start_date.strftime('%Y-%m-%d')} to {end_date.strftime('%Y-%m-%d')}
Statistical Summary:
- Mean: {stats['mean']:.2f}
- Median: {stats['median']:.2f}
- Standard Deviation: {stats['std']:.2f}
- Range: [{stats['min']:.2f}, {stats['max']:.2f}]
Raw Data Sample: {window_df[[date_column, value_column]].head(10).to_string()}"""

            metadata = {
                'start_date': str(start_date),
                'end_date': str(end_date),
                'mean_value': stats['mean'],
                'data_type': 'time_series_window'
            }
            documents.append(Document(page_content=content, metadata=metadata))
        return documents
LangGraph State and Workflow
class TemporalInfo(BaseModel):
    time_range: str = Field(description="past, future, or all")
    specific_period: Optional[str] = Field(description="dates mentioned")
    aggregation: Optional[str] = Field(description="average, trend, forecast, anomaly")

class TimeSeriesRAGState(TypedDict):
    question: str
    time_range: TemporalInfo
    retrieved_documents: Annotated[List[Document], operator.add]
    temporal_context: str
    final_answer: str
    messages: Annotated[List[str], operator.add]

class TimeSeriesRAG:
    def __init__(self, config: Config):
        self.config = config
        self.processor = TimeSeriesProcessor()
        self.doc_creator = TimeSeriesDocumentCreator(self.processor)
        self.llm = ChatOpenAI(model=config.MODEL_NAME, temperature=0)
        self.embeddings = OpenAIEmbeddings(model=config.EMBEDDING_MODEL)
        self.vectorstore = None
        self.graph = self._build_graph()

    def _build_graph(self):
        workflow = StateGraph(TimeSeriesRAGState)
        workflow.add_node("parse_temporal_query", self._parse_temporal_query)
        workflow.add_node("retrieve_documents", self._retrieve_documents)
        workflow.add_node("analyze_temporal_context", self._analyze_temporal_context)
        workflow.add_node("generate_answer", self._generate_answer)

        workflow.set_entry_point("parse_temporal_query")
        workflow.add_edge("parse_temporal_query", "retrieve_documents")
        workflow.add_edge("retrieve_documents", "analyze_temporal_context")
        workflow.add_edge("analyze_temporal_context", "generate_answer")
        workflow.add_edge("generate_answer", END)

        return workflow.compile(checkpointer=MemorySaver())

    # Node implementations follow the same exact logic as the original source...
Comparison Matrix
| Aspect | Traditional RAG | Time Series RAG | Agentic RAG |
|---|---|---|---|
| Primary Use Case | Document Q&A, knowledge retrieval | Temporal data analysis, forecasting | Complex multi-step reasoning |
| Data Type | Unstructured text, documents | Time-stamped numerical/categorical data | Mixed: documents, APIs, tools |
| Retrieval Strategy | Semantic similarity (embeddings) | Temporal + semantic similarity | Multi-strategy |
| Processing Complexity | Low–Medium | Medium–High | High–Very High |
| Query Understanding | Semantic meaning | Temporal context + semantic meaning | Intent, planning, tool selection |
| Response Generation | Direct LLM generation | Statistical analysis + LLM generation | Multi-step reasoning |
| Latency | Low (1–3 sec) | Medium (3–10 sec) | High (10–60 sec) |
| Scalability | Highly scalable | Moderate (compute-intensive) | Limited (overhead) |
Key Features of Time-Series RAG
- Robust Parsing: Pydantic models ensure structured temporal information extraction.
- Rich Context: Combines statistical summaries, patterns, and forecasts.
- Temporal Intelligence: Understands past/present/future queries and specific periods.
- Workflow Visibility: Tracks all processing steps using LangGraph's state management.
Use Time Series RAG When:
- ✅ Your data has temporal components.
- ✅ You need trend analysis and forecasting.
- ✅ You work with metrics, logs, or sensor data.
- ✅ Anomaly detection is important.
- ✅ Questions involve "when", "trend", "forecast".
Future Trends
- Multimodal Time Series RAG: Images, video, audio with timestamps.
- Real-time Streaming RAG: Continuous data ingestion for live dashboards.
- Self-improving RAG: Systems that learn from feedback loops to refine forecasting weights.
Related Guides
Build a Local LLM Zero-Shot Classifier You Can Actually Deploy
Learn how to run zero-shot text classification on a local model with Ollama, enforce strict JSON outputs, and add confidence-aware routing for production triage.
The Complete Developer Guide to Running LLMs Locally: From Ollama to Production
Everything you need to run LLMs on your own hardware in 2026: VRAM sizing, model formats, an 8-tool comparison table, a full local RAG pipeline, and Docker production deployment with GPU passthrough and Nginx auth.
Event-Driven Architecture for Agentic AI: The Architect's Guide
A comprehensive architectural guide to designing resilient, real-time agentic AI systems using event-driven architecture — covering loose coupling, fault isolation, reference architecture, and governance patterns.